Oscilloscope panel
You can click the right button to enter the oscilloscope panel.
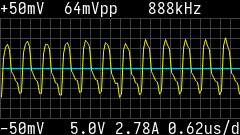
In the oscilloscope panel, you can see the ripple voltage on VBUS.
Values on the left side of the panel display the highest and lowest voltages in the graph respectively(“+50mV” and “-50mV” in this example).
The upper middle of the panel displays the peak-to-peak value of the voltage (64mVpp in this example) and the primary component frequency (888kHz in this example); the lower part displays the real-time DC current and voltage on the VBUS. The time interval of each grid is displayed in the lower right corner.
Pause
The icon on the upper right side of the panel shows the current status (Paused or not), means it is continuously graphing, and means the graphing is paused. To pause/continue the graphing, click the middle button.
Sampling rate adjustment
Press the left or right key to adjust the sampling rate, to the left is to decrease, and to the right is to increase. After adjustment, the sampling rate will be briefly displayed on the screen. The maximum sampling rate on this panel is 8Ms/s.
Exit graphing
Double-click the middle key to exit graphing.